Highlights
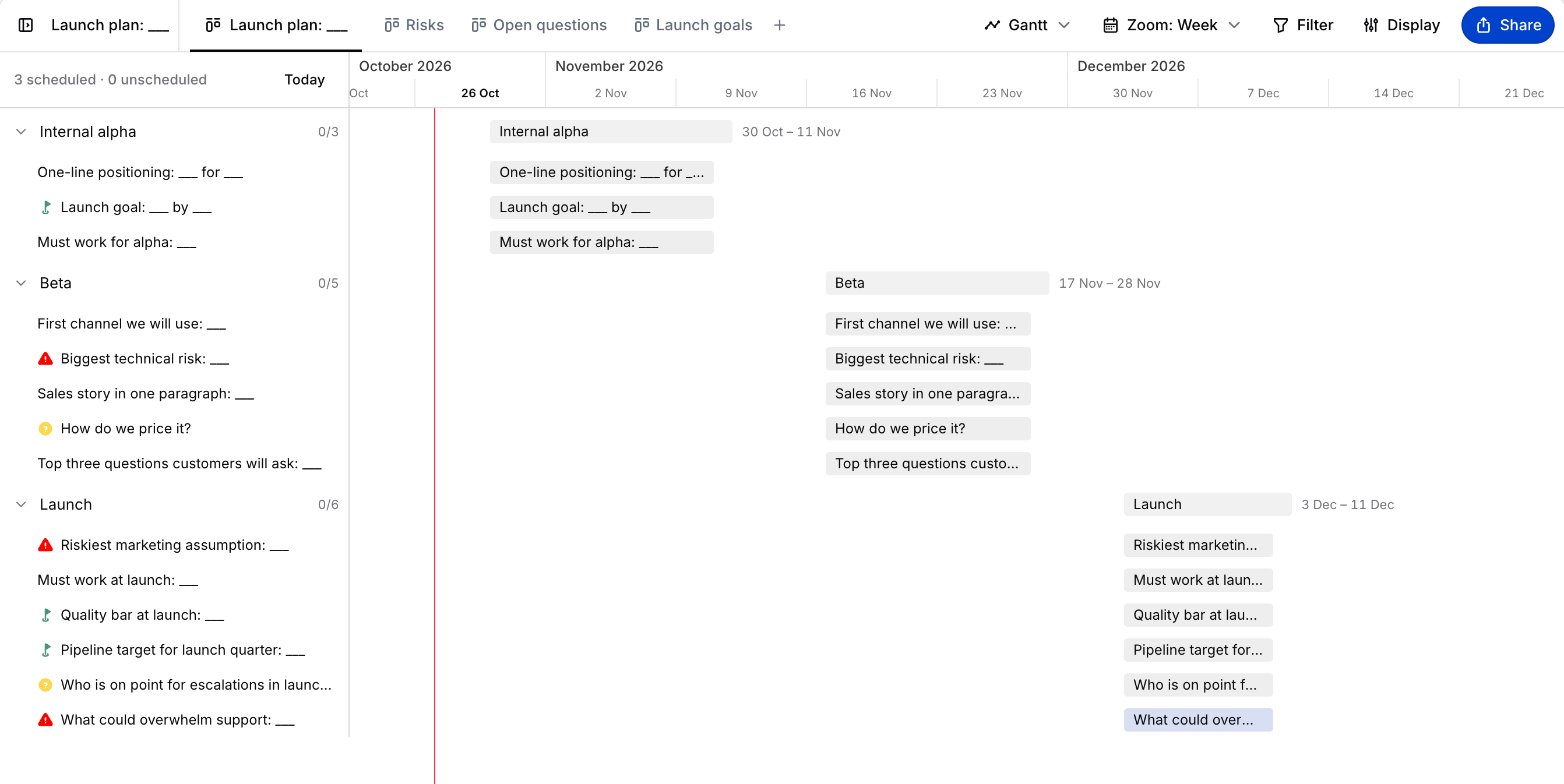
Many more people are managing projects through Cartographer and need better ways to show their progress against a timeline. So we added Gantt charts. Each milestone is a bar with its cards underneath.
- Drag bars to change dates
- Zoom by day, week, month or quarter
- Read and set dates over MCP
Reading the Chart
- Cards without their own dates show their milestone’s range.
- Milestones show how many of their cards are done.
- A line marks today. Today scrolls back to it.
- Milestones without dates sit under Unscheduled. Cards without a milestone sit under Backlog.
Setting Dates
- Drag a bar to move it.
- Drag either end to change the start or target date.
- Hover an undated row, then click or drag to set dates.
In Month and Quarter zoom, bars snap to weeks. Hold Alt to snap to days.
Filters and Display
Cards that don’t match your filters are dimmed. Type, status and colour follow your Display settings.
Dates Over MCP
Cards and milestones have a startDate and targetDate. Your AI can read and set them through the MCP server.
Shortcuts
| Keys | Action |
|---|---|
| Up Down | Move between rows |
| Enter | Select the bar, or set dates on a row without any |
| Shift + Enter | Open the card or milestone |
| Left Right | Move the bar |
| Shift + Left Right | Move the target date |
| Alt + Left Right | Move the start date |
| Backspace | Clear the dates |
| Esc | Leave the bar |
| - = | Zoom out and in |
| T | Scroll to today |
Feedback
We’d love to get your feedback – open the help menu and send us a message!
